
Tuesday, 1 November 2016

Monday, 31 October 2016
All Saint's Day
All Saint's Day

If I could choose a saint, I would choose St. Mary, the Blessed Virgin Mother of God.
I chose her because she is the Mother of Jesus, she is a very caring Mother who loves and cares for all of us and especially, Jesus. We are all important to her so, we all love her in our heart and in our mind. For this, it means that she is also important for us and for all people in the world. She is also the Patron Saint of humanity, which means us and all the people who lived or who are still living in this world.
Thursday, 20 October 2016
Sunday, 9 October 2016
Natural Satellites

This presentation is my independent inquiry where I wrote my own inquiry questions to target finding and extending my knowledge and understanding about Natural Satellites.
Wednesday, 21 September 2016
Tuesday, 20 September 2016
Monday, 19 September 2016
Maths Survey Data
A Maths Survey with 3 Year 8 people and another 3 Year 7 people.
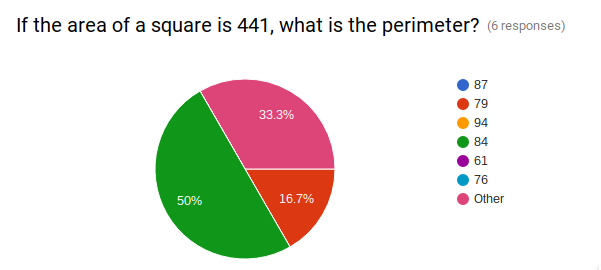
This pie chart shows that there are half of the people to get the correct answer for the question(if the area of a square is 441, what is the perimeter?), however, the other half answered it incorrectly.(Answer - 84)

This pie chart shows that half of the people answered the question(What is the square root for the number 1936?) correctly, while half of them answered it incorrectly and answering with another number. (Answer - 44)
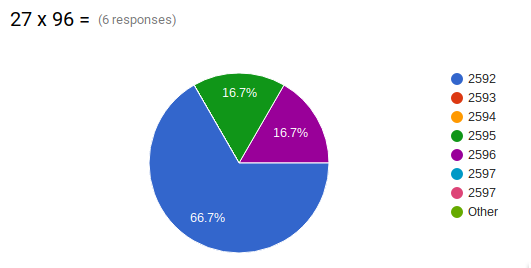
This pie chart shows that there are only 66.7% people to get the answer correctly for the question(27 x 96 = ) but on the other side, there are 16.7% people to answer 2595 and another 16.7% people to answer 2596. (Answer - 2592)
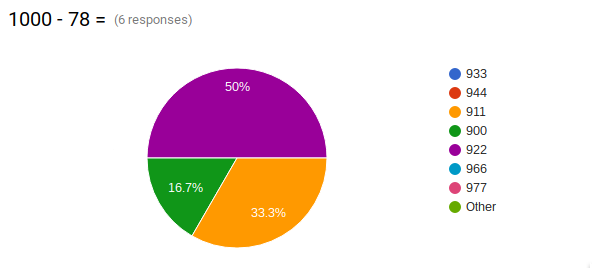
This pie chart shows that there are half of the people to answer the question(1000 - 78 =) correctly, while 16.7% people to answer 900 and 33.3% people to answer 911. (Answer - 922)
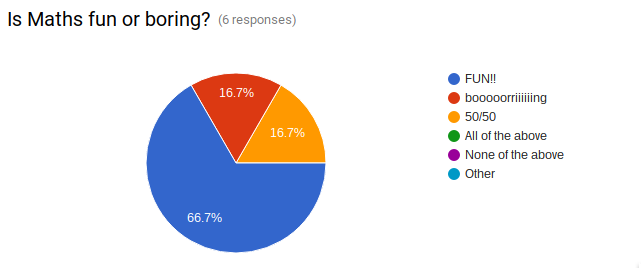
This pie chart shows that there are 66.7% people to find maths fun, 16.7% people to find maths boring and 16.7% people to find it both.
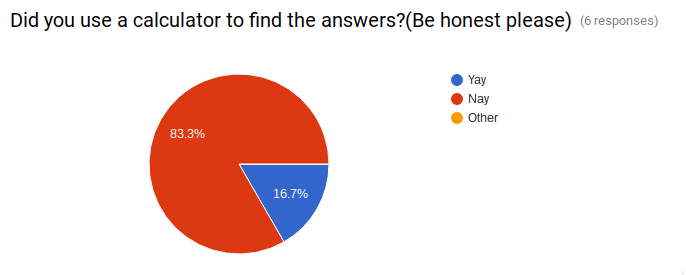
Lastly, there are 83.3% people didn’t use the calculator to find the answers and 16.7% people to use a calculator.
Walht:
- Write a survey using google forms
- Use the feedback to create and display that data in a pie graph
- Analyse the results
Subscribe to:
Posts (Atom)