
This graph shows the weight-building programme by Emily where the weight is going up and going down every month.

Walht: create graphs using a spreadsheet and to analyse data in those displays.

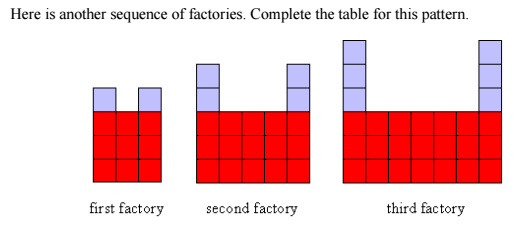
Factory Number
|
1
|
2
|
3
|
4
|
5
|
number of grey squares (x2)
|
2
|
4
|
6
|
8
|
10
|
number of red squares (+6)
|
9
|
15
|
21
|
27
|
33
|
number of all squares
|
11
|
19
|
27
|
35
|
43
|
